Note: This post is part of a series on developing resmack. See the resmack tag for all posts in the series.
← Part 2 Full Fuzzer Detour
Part 4 Grammar Mutations →
This is a small follow-up from the previous post on creating an experimental snapshot-based fuzzer (resmack-fuzz-test) that used perf events for its feedback metric during fuzzing.
The trivial target that I used during development did not make apparent any performance hits that fuzzing with perf events as feedback cause. This blog post is about the benchmarks used to test the performance impact of using perf events as feedback.
Trivial Target Link to heading
Below is the trivial target used during the development of of resmack-fuzz-test:
void do_something_else(char *data) {
    if (strlen(data) < 9) {
        printf("Returning! strlen(data): %lu\n", strlen(data));
        fflush(stdout);
        return;
    }

    if (data[0] == 'R') {
        if (data[1] == 'E') {
            if (data[2] == 'S') {
                if (data[3] == 'M') {
                    if (data[4] == 'A') {
                        if (data[5] == 'C') {
                            if (data[6] == 'K') {
                                if (data[7] == '!') {
                                    if (data[8] == '!') {
                                        PRINT(">> CRASH!\n");
                                        char *blah = 0;
                                        blah[0] = 'A';
                                    }
                                }
                            }
                        }
                    }
                }
            }
        }
    }
}
When running resmack-fuzz-test with the trivial target above, we get anywhere between 16k and 20+k iterations per second.
The major item to note here is that very little time is spent actually in the target program. Any performance overhead of using perf events will not be noticeable.
Recall the recorded perf stats from the previous post:
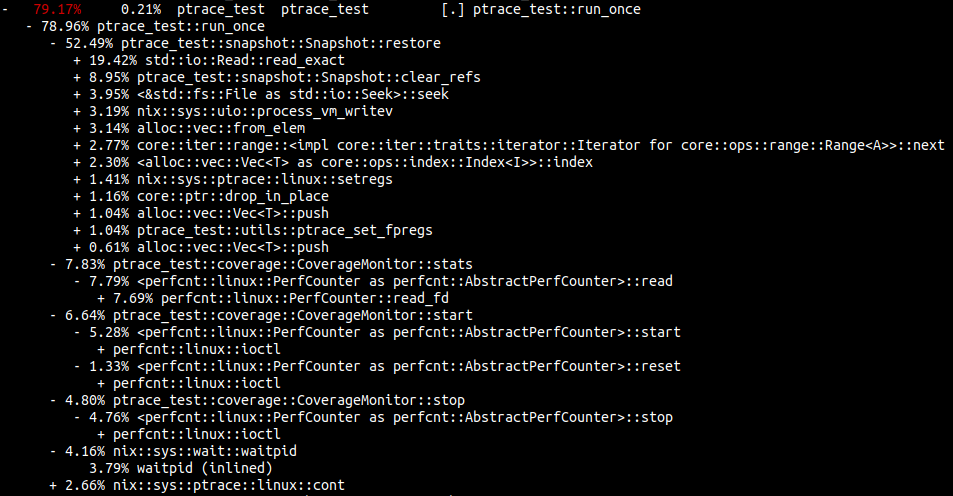
Remember that this is from the perspective of the fuzzer process, not the snapshotted target process.
The key areas where time is spent are listed below:
| percent | Description | Technical |
|---|---|---|
| 52.49% | Snapshot restoration | ptrace_test::snapshot::Snapshot::restore |
| 7.83% | Perf events stats collection | ptrace_test::coverage::CoverageMonitor::stats |
| 6.64% | Perf events start recording | ptrace_test::coverage::CoverageMonitor::start |
| 4.80% | Perf events stop recording | ptrace_test::coverage::CoverageMonitor::stop |
| 4.16% | Running the target proces | nix::sys::wait::waitpid |
The fuzzing process is only waiting on the process to run 4.16% of the time!
Benchmarks Link to heading
The perf benchmarks are run with the command below. The summary results of the
benchmark can be found at target/critierion/perf/report/index.html:
cargo bench --bench perf -- --verbose
The perf benchmarks
run the do_work() function below under different scenarios:
fn do_work() {
    let mut data: HashMap<usize, Vec<usize>> = HashMap::new();
    for i in 0..0x1000usize {
        if i % 4 == 0 {
            data.entry(4).or_insert(Vec::new()).push(i);
        }
        if i % 3 == 0 {
            data.entry(3).or_insert(Vec::new()).push(i);
        }
        if i % 2 == 0 {
            data.entry(2).or_insert(Vec::new()).push(i);
        }
    }
}
The scenarios do_work() is run under are:
| scenarios | brnch | insts | !perf |
|---|---|---|---|
| 1 | X | ||
| 2 | X | X | |
| 3 | X | ||
| 4 | X |
Below is the zoomed-in relevant portion of the violin graph comparing each of the scenarios:
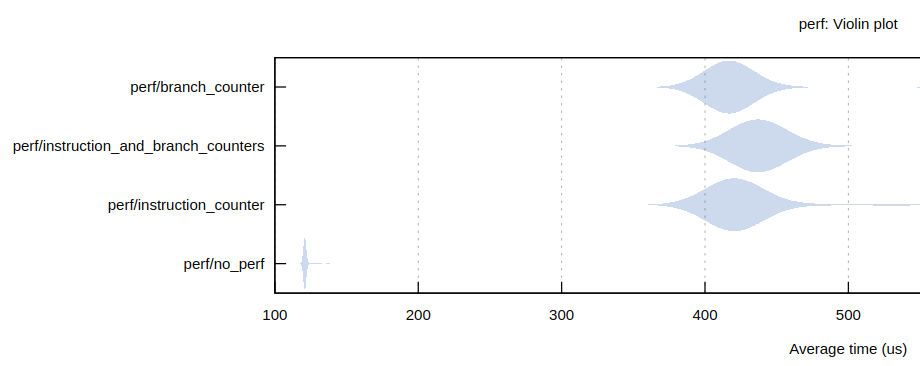
Somewhat surprisingly, little difference exists between using one or two performance counters at the same time.
The same can definitely not be said for the difference between no perf counters and using perf counters.
There is roughly a 4x performance hit when running code with perf counters.
Full Benchmark Output Link to heading
The full benchmark output may be of interest to some of you.